
Finally, Software That Turns Confusing Math Equations Into Simple Images
Computer scientists at Carnegie Mellon University have come up with a new tool to automatically turn mathematical equations into visualizations.
Unlike a graphing calculator, this software can create depictions of not only basic functions, but also complex relationships across various fields of math.
The researchers will formally present their program and forthcoming paper at the SIGGRAPH 2020 Conference on Computer Graphics and Interactive Techniques, which takes place virtually this July.
Math equations can feel like a banal abstraction without images to make sense of the strings of numbers, letters, and Greek symbols. Consider the Pythagorean theorem, an essential relation in geometry among three sides of a triangle: a2 + b2 = c2. When the triangle has a right angle, the hypotenuse is always equal to the squares of the two shorter sides. But the average student might miss that mathematical beauty from the equation alone.
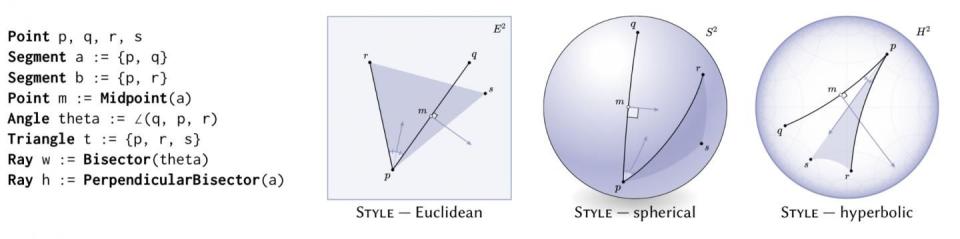
So computer scientists at Carnegie Mellon University have built a software tool to translate the language of numbers into pictures. Dubbed "Penrose," for the noted mathematician and physicist Roger Penrose—who is known for concepts like twistor theory—the system goes beyond the capabilities of a graphing calculator. Not only can you input simple expressions, but also complex relationships from pretty much any area of math.
"Some mathematicians have a talent for drawing beautiful diagrams by hand, but they vanish as soon as the chalkboard is erased," Keenan Crane, an assistant professor of computer science and robotics, said in a prepared statement. "We want to make this expressive power available to anyone."
Because high-quality diagrams take a great deal of monotonous work to produce, making them hard to come by, Crane and his team have turned to diagram-drawing experts to create the underlying logic for the program, even building out a brand-new programming language just for encoding instructions in Penrose. So when other users access Penrose, they can use familiar mathematical language while the computer crunches the instructions.
"We started off by asking: 'How do people translate mathematical ideas into pictures in their head?'" Katherine Ye, a Ph.D. student in the Computer Science Department, said in the release. "The secret sauce of our system is to empower people to easily 'explain' this translation process to the computer, so the computer can do all the hard work of actually making the picture."
After a user inputs how they want the visualization to look—you can select from a Venn diagram, a 3D Venn diagram, trees, vector points illustrated by arrows, points shown as dots, or continuous lines—the computer comes up with a few candidate diagrams that the user can select from and edit until they come up with the perfect graphic.
The tool won't be available until sometime in July, after the researchers present Penrose at the SIGGRAPH 2020 Conference on Computer Graphics and Interactive Techniques, which organizers are holding virtually next month.
You Might Also Like

